transplot
Requirements and installation
Transplot is compatible with Windows, Mac OS X and Linux operating systems. It requires the following packages:
- regex==2017.11.9
- pandas==0.20.3
- matplotlib==1.5.3
- numpy==1.13.3
- setuptools==38.4.0
Run the following commands to clone and install from GitHub.
$ git clone https://github.com/mframpton/transplot
$ cd transplot
$ pip install -r requirements.txt
$ python setup.py install
Short tutorial
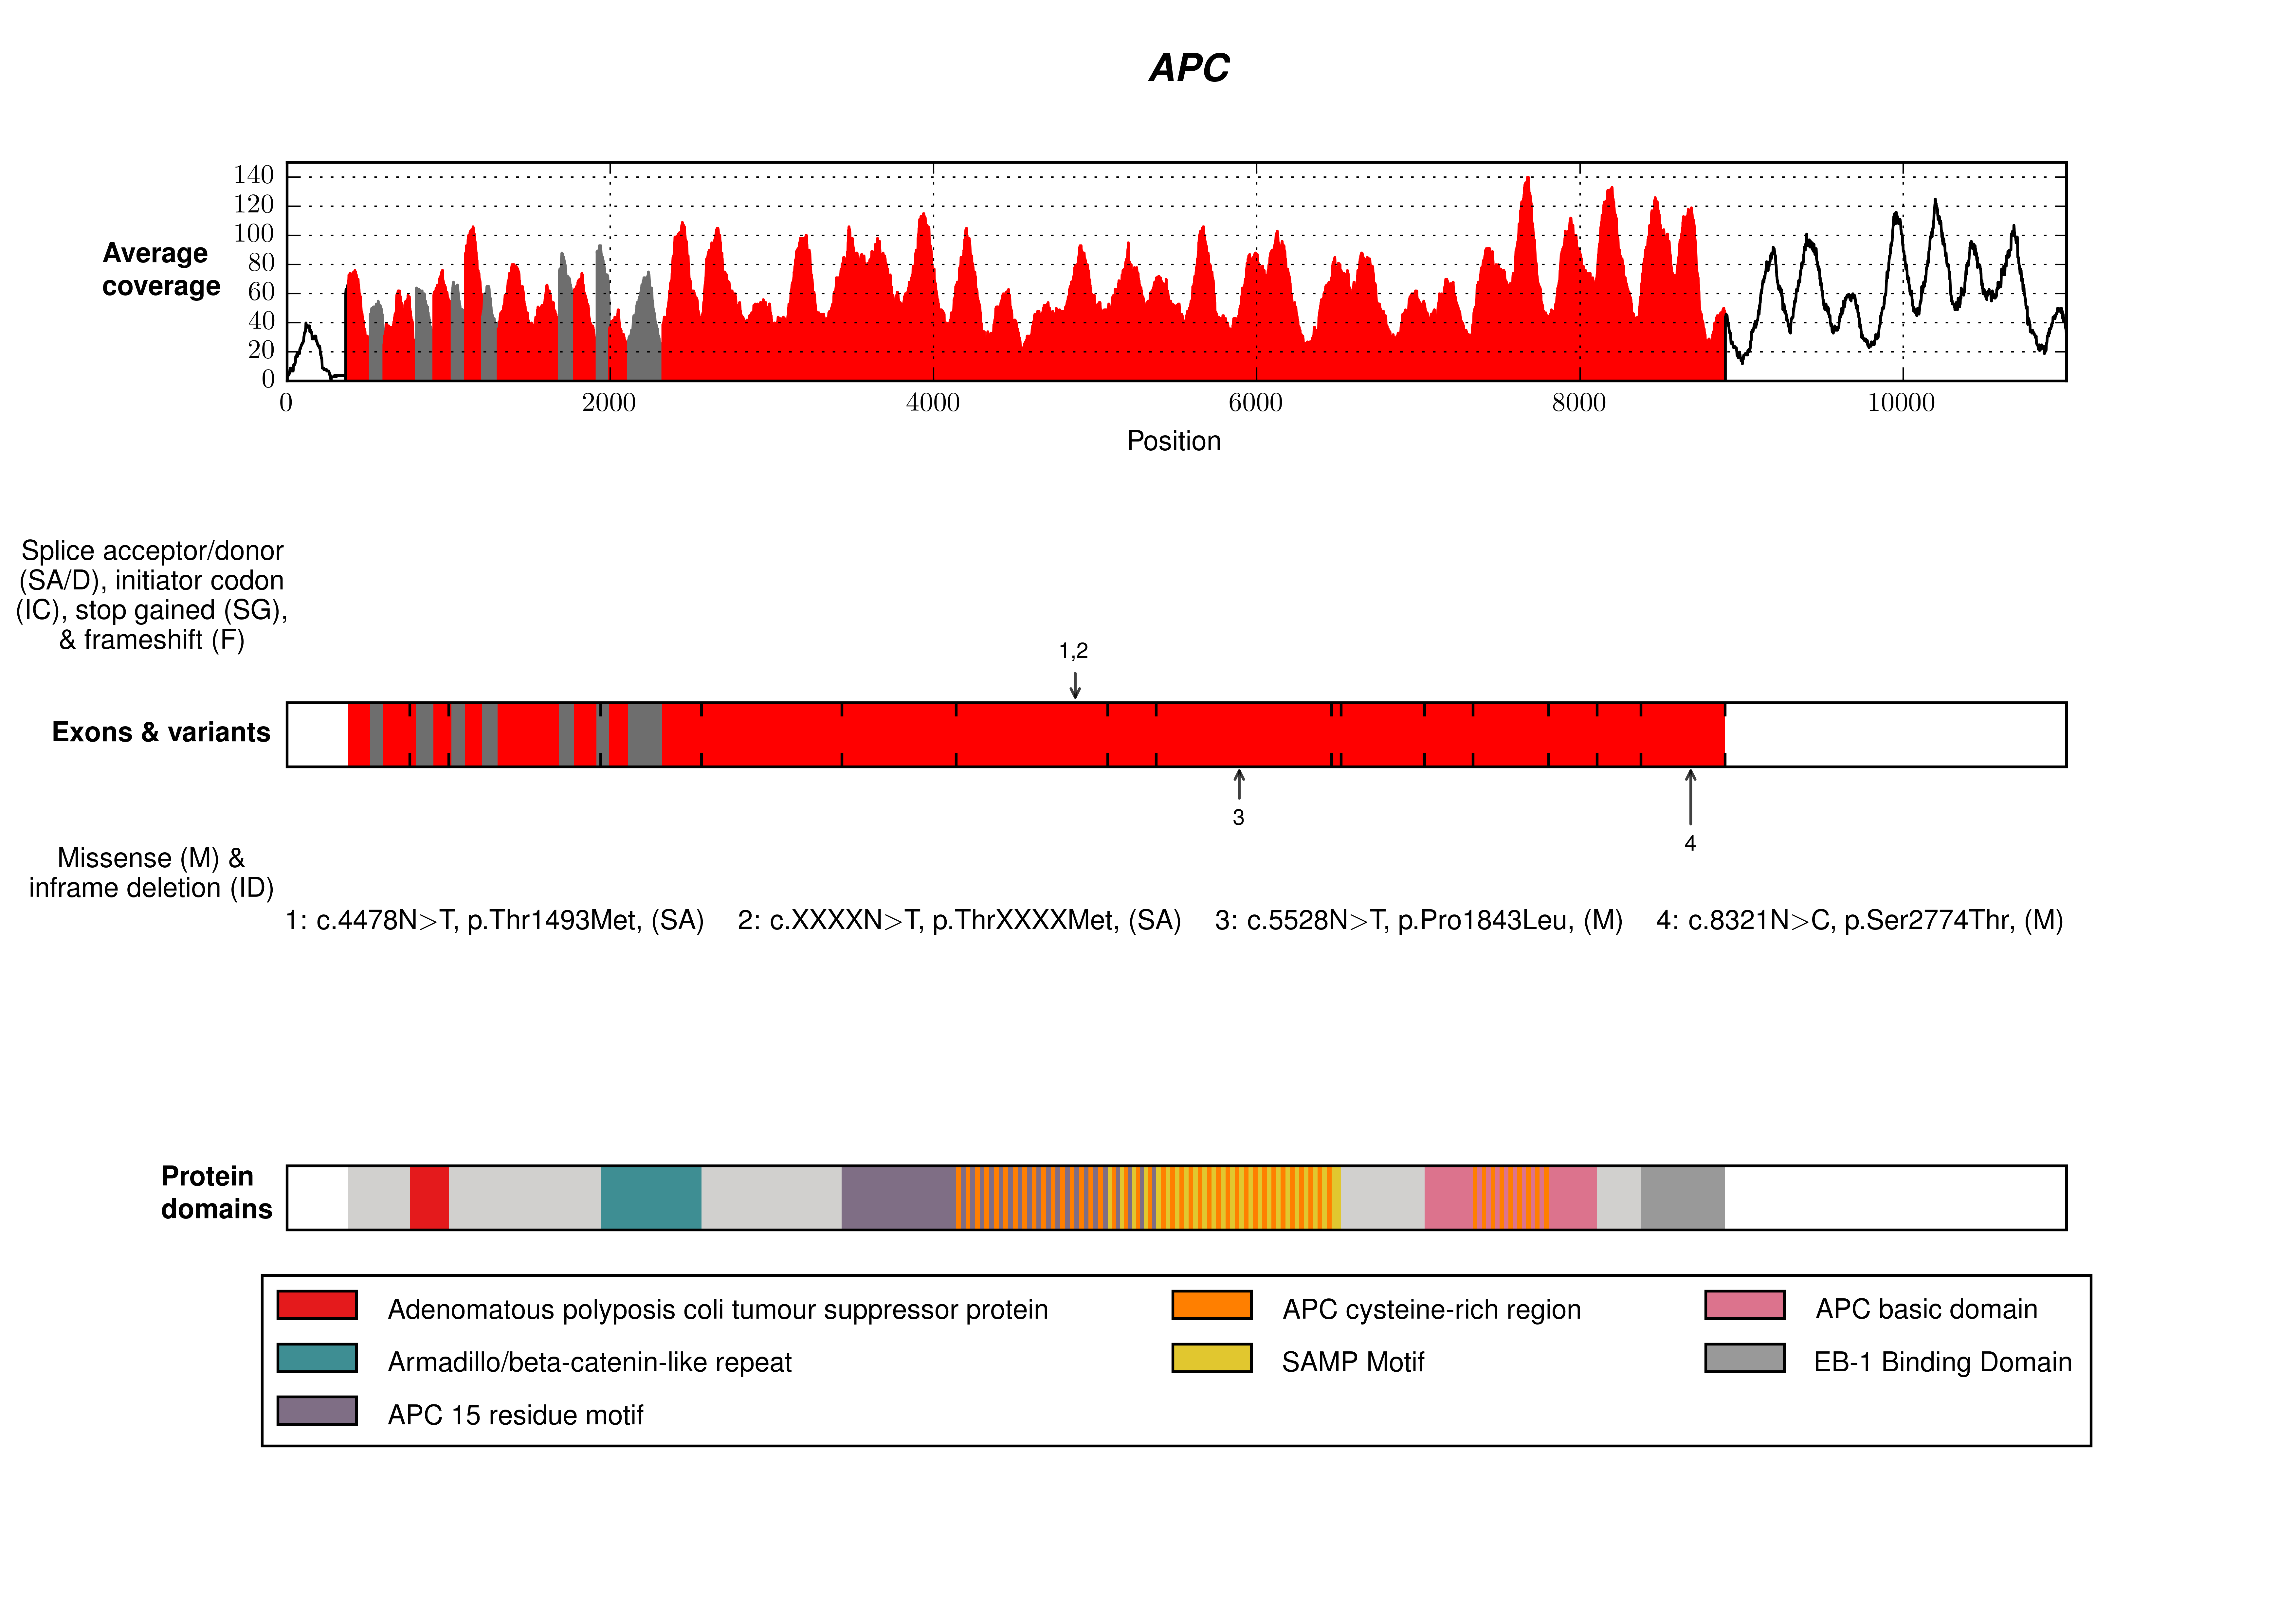
The repository contains an example script in src/examples which demonstrates how to use transplot to make single and multi-track plots using example data in examples/data/input.
The following code in the example script makes the 3-track plot shown below, plus five additional plots which contain one or two of the same tracks.
from transplot import transplotter as ngstp
from transplot import settings as s
import sys
import os

#Make the input/output dir paths.
input_dir = os.path.abspath(os.path.join(os.path.dirname(os.path.abspath(__file__)),"..","data","input"))
output_dir = os.path.abspath(os.path.join(os.path.dirname(os.path.abspath(__file__)),"..","data","plots"))
if not os.path.exists(output_dir):
    os.makedirs(output_dir)

#Set other paths/variables.
apc_utrs_txt = os.path.join(input_dir,"APC_utrs.txt")
apc_utrs_reverse_txt = os.path.join(input_dir,"APC_utrs_manual_reverse.txt")
apc_canon_trans = "ENST00000457016"
apc_coverage_csv = os.path.join(input_dir,"APC_{0}_small.csv".format(apc_canon_trans))
apc_coverage_reverse_csv = os.path.join(input_dir,"APC_{0}_small_reverse.csv".format(apc_canon_trans))
apc_variants_cases_txt = os.path.join(input_dir,"APC_variants_CASES.txt")
apc_variants_cases_reverse_txt = os.path.join(input_dir,"APC_variants_CASES_reverse.txt")
protein_domain_txt = os.path.join(input_dir,"APC_exoplot_domains_wt_overlaps.txt")

#Print out help message for ngs_transcript_plotter module.
help(ngstp)

#Make a protein domain color file.
protein_domain_color_csv = os.path.join(input_dir,"protein_domain_color.csv")
ngstp.make_protein_domain_color_file(
        protein_domain_file=os.path.join(input_dir, "APC_exoplot_domains_wt_overlaps.txt"),
        transcript_l= [apc_canon_trans],
        database="Pfam",
        sortby_col_l=["Start"],
        out_path=protein_domain_color_csv)

#Make exon coordinates files.
exon_coord_csv,exon_coord_reverse_csv = os.path.join(input_dir , "APC_exon_coord.csv"),os.path.join(input_dir , "APC_exon_coord_reverse.csv")
ngstp.make_exon_coord_file(apc_coverage_csv,apc_canon_trans,exon_coord_csv)
ngstp.make_exon_coord_file(apc_coverage_reverse_csv,apc_canon_trans,exon_coord_reverse_csv)

#Display the settings.
setting_dict = s.get_setting_dict()
s.display_setting_dict(setting_dict)

#Make example plots - same data but with different combinations of the 3 tracks.
track_ll = [["111"],["110"],["101"],["011"],["010"],["001"]]
plot_path_l = [os.path.join(output_dir,"APC_cases_make_png_{0}.png".format(i+1)) for i in range(len(track_ll))]
for i in range(len(track_ll)):
    ngstp.make_png([apc_canon_trans],
                   [r'\textbf{\textit{APC}}'],
                   track_ll[i],
                   [["543_A10"]],
                   [apc_utrs_txt],
                   [exon_coord_csv],
                   [apc_coverage_csv],
                   [apc_variants_cases_txt],
                   [protein_domain_txt],
                   protein_domain_color_csv,
                   setting_dict,
                   plot_path_l[i])
API reference
transplotter
-
transplotter.get_exon_bound_color_l(exon_coord_df, utr_df, strand)[source]¶ Get the bounds, colors and edge colors required to generate a color bar that displays the utrs and exons for a transcript.
- Args:
- exon_coord_df (DataFrame): contains the exon base pair and transcript position coordinates.utr_df (DataFrame): contains the utr base pair and transcript position coordinates.strand (str): specifies whether the transcript is on the positive or negative strand.
- Returns:
- exon_bound_color_ll (list of lists of ints and strs): contains bound_l, the list of bounds, color_l, the list of colors and edge_color_l, the list of edge colors.
-
transplotter.make_exon_coord_file(cov_file, transcript, out_path)[source]¶ Make an exon coordinate file from a coverage file.
- Args:
- cov_file (str): path to coverage file.transcript (str): Ensembl transcript ID.out_path (str): path to write the exon coordinate file to.
-
transplotter.make_png(transcript_l, title_l, track_l, sample_ll, utr_file_l, exon_coord_file_l, cov_file_l, variant_file_l, protein_domain_file_l, protein_domain_color_file, setting_dict, png_file)[source]¶ Make a png which contains coverage/variants/protein domain tracks for 1 or more transcripts, subject to space limitations.
- Args:
- transcript_l (list of strs): Ensembl transcript ID(s)title_l (list of strs): title to use for each transcript.track_l (list of strs): list of strings of length 3 which encode whether to generate each of the 3 tracks (coverage, variants, protein domains).sample_ll (list of list of strs): list of lists of sample IDs.utr_file_l (list of strs): list of utr file paths.exon_coord_file_l (list of strs): list of exon coordinate file paths.cov_file_l (list of strs): list of coverage file paths.variant_file_l (list of strs): list of variant file paths.protein_domain_file_l (list of strs): list of protein domain file paths.protein_domain_color_file (str): protein domain color file.setting_dict (dictionary): settings for making the png.png_file (str): path to write the png file to.
-
transplotter.make_protein_domain_color_file(protein_domain_file, transcript_l, database, sortby_col_l, out_path)[source]¶ Make a protein domain color file.
- Args:
- protein_domain_file (str): path to file containing the protein domain information.transcript_l (list of strs): list of Ensembl transcript IDs.database (str): protein domain database.sortby_col_l (list of strs): list of names of columns to sort the DataFrame by.out_path (str): path to write the protein domain color file to.
coverage
-
coverage.get_cov_df(cov_file, transcript, bp_start, bp_end, sample_l)[source]¶ Get the coverage data for a transcript. If bp_start and bp_end are None, then coverage data for the whole transcript will be extracted. The coordinates in cov_df and exon_coords_df are 1-based.
- Args:
- cov_file (str): path to file containing the coverage data.transcript (str): Ensembl transcript ID.bp_start (int): base pair start coordinate.bp_end (int): base pair end coordinate.sample_l (list of strs): list of sample IDs.
- Returns:
- cov_df (DataFrame): contains the coverage data.
-
coverage.get_exon_coord_df(cov_df)[source]¶ Make an exon coordinate file.
- Args:
- cov_df (DataFrame): contains the coverage information.
- Returns:
- exon_coord_df (DataFrame): contains the exon base pair and transcript position coordinates.
-
coverage.make_track(track, cov_df, bound_l, color_l, edge_color_l, setting_dict)[source]¶ Make the coverage track.
- Args:
- track (matplotlib.axes.Axes): the axis for this coverage track.cov_df (DataFrame): contains the coverage data.bound_l (list of ints): bounds of the utrs and exons.color_l (list of strs): colors for the utrs and exons.edge_color_l (list of strs): edge colors for the utrs and exons.setting_dict (dictionary): settings for making the png.
protdomains
-
protdomains.generate_stripe_ls(whole_trans_bound_ll, whole_trans_domain_ll, i, stripe_min_bases)[source]¶ Generate the stripe lists for regions which contain greater than 1 protein domain. The 1st color will be for a protein domain not in the left-neighbouring region, and the last will be for a protein domain not in the right-neigbouring region.
- Args:
- whole_trans_bound_ll (list of lists of ints): lists containing start and end bound coordinates covering the whole transcript, where contiguous regions differ wrt their contents (utr, protein domain(s), empty).whole_trans_domain_ll (list of lists of strs): the contents (utr, protein domain(s), empty) of each region in whole_trans_bound_ll.i (int): index in whole_trans_bound_ll.stripe_min_bases: minimum stripe width in bases.
- Returns:
- stripe_bound_l (list of ints): bounds for stripes, including end bound of region.stripe_domain_l (list of strs): protein domains corresponding to the stripe bounds (alternates through the protein domains in this region).
-
protdomains.get_bound_color_ls_for_cb(protein_domain_df, utr_df, protein_domain_color_s, stripe_min_bases)[source]¶ Get the bound and color lists for the colorbar. These are (1) pd_bound_l, list of protein domain bounds which can be used to mark the protein domains on the variant track; (2) whole_trans_stripe_bound_l, list of regions covering the whole transcript in which contiguous regions have different contents (utr, protein domain(s), empty), and regions containing > 1 protein domain are striped. This list will be used to make the protein domain colorbar; (3) whole_trans_stripe_color_l, list of colors corresponding to whole_trans_stripe_bound_l.
- Args:
- protein_domain_df (DataFrame): contains the protein domain information.utr_df (DataFrame): contains the utr information.protein_domain_color_s (Series): colors indexed by protein domain IDs.stripe_min_bases: minimum stripe width in bases.
- Returns:
- pd_bound_l (list of ints): list of protein domain boundswhole_trans_stripe_bound_l (list of ints): list of utr and protein domain boundswhole_trans_stripe_color_l (list of strs and tuples of floats): list of corresponding colors for the latter.
-
protdomains.get_legend_num_cols(protein_domain_description_l, max_num_chars_per_row)[source]¶ Work out the number of columns to use in the protein domain track legend.
- Args:
- protein_domain_description_l (list of strs): protein domain descriptionsmax_num_chars_per_row (int): maximum number of characters for 1 row of the legend.
- Returns:
- num_cols (int): number of columns.
-
protdomains.get_protein_domain_color_s(protein_domain_df)[source]¶ Create a protein domain color series where the indexes are the protein domains, and the values are the colors.
- Args:
- protein_domain_df (DataFrame): contains the protein domain information
- Returns:
- protein_domain_color_s (Series): contains colors indexed by protein domain.
-
protdomains.get_protein_domain_df(protein_domain_file, transcript_l, database, sortby_col_l)[source]¶ Read the protein domain information from a tsv file into a DataFrame.
- Args:
- protein_domain_file (str): path to protein domain file.transcript_l (list of strs): list of Ensembl transcript IDs.database (str): protein domain database.sortby_col_l (list of strs): columns to sort the DataFrame by.
- Returns:
- protein_domain_df (DataFrame): contains the protein domain information.
-
protdomains.get_whole_trans_bound_ll(pd_utr_bound_ll)[source]¶ Divide the whole transcript into regions such that contiguous regions differ wrt their contents (utr, protein domain(s), empty), and return their bounds.
- Args:
- pd_utr_bound_ll (list of list of ints): the start and end bounds of the utrs and protein domains.
- Returns:
- whole_trans_bound_ll (list of list of ints): lists containing start and end bound coordinates covering the whole transcript, where contiguous regions differ wrt their contents (utr, protein domain(s), neither).
-
protdomains.get_whole_trans_domain_ll(whole_trans_bound_ll, pd_utr_bound_ll, domain_l)[source]¶ Get the utr or protein domain(s) in each region defined in whole_trans_bound_ll.
- Args:
- whole_trans_bound_ll (list of lists of ints): lists containing start and end bound coordinates covering the whole transcript, where contiguous regions differ wrt their contents (utr, protein domain(s), empty).pd_utr_bound_ll (list of lists of ints): the start and end bounds of the utrs and protein domains.domain_l (list of strs): list of protein domains corresponding to the bounds in pd_utr_bound_ll.
- Returns:
- whole_trans_domain_ll (list of lists of strs): the contents (utr, protein domain(s), empty) of each region in whole_trans_bound_ll.
-
protdomains.make_legend(protein_domain_track, protein_domain_df, protein_domain_color_s, fontsize, max_chars_per_row, bbox)[source]¶ Make the protein domains track legend.
- Args:
- protein_domain_track (matplotlib.axes.Axes): axis for the protein domain track.protein_domain_df (DataFrame): contains the protein domain information.protein_domain_color_s: colors indexed by protein domain IDs.fontsize (int): fontsize for text in the legend.max_chars_per_row: maximum number of characters for 1 row of the legend.bbox: where to anchor the legend (uses the axes coordinate system so (0,0) is bottom left and (1.0,1.0) is top right.
-
protdomains.make_track(track, protein_domain_df, utr_df, protein_domain_color_s, setting_dict, variant_track)[source]¶ Make the protein domain track.
- Args:
- track (matplotlib.axes.Axes): axis for the protein domain track.protein_domain_df (DataFrame): contains the protein domain information.utr_df (DataFrame): contains the utr information.protein_domain_color_s (Series): colors indexed by protein domain IDs.setting_dict (dictionary): settings for making the png.variants_track (matplotlib.axes.Axes): axis for the variant track.
-
protdomains.set_colorbar_ticks(track, bound_l, transcript_len, top_or_bottom, markersize, markeredgewidth)[source]¶ Set the ticks on a colorbar.
- Args:
- track (matplotlib.axes.Axes): axis for a track.bound_l: list of intstranscript_len (int): length of the transcript.top_or_bottom (str): indicates whether the ticks should be below or above or both.markersize (int): tick size.markeredgewidth (int): tick width.
- Returns:
- track (matplotlib.axes.Axes): the axis with ticks added.
utrs
-
utrs.get_utr_df(utr_file, strand, transcript)[source]¶ Read the UTR information into a DataFrame.
- Args:
- utr_file (str): path to file containing the utr information.strand (str): whether the transcript is on the positive or negative strand.transcript (str): Ensemble transcript ID.
- Returns:
- utr_df: DataFrame
variants
-
variants.annotate_track_with_arrow(arrow_bin, variant_track, setting_dict)[source]¶ Annotate the variants track with an arrow.
- Args:
- arrow_bin (int):variant_track (matplotlib.axes.Axes): axis for the variant track.setting_dict (dictionary): settings for making the png.
-
variants.annotate_track_with_variants(variant_track, variant_df, transcript_len, setting_dict)[source]¶ Annotate the variants track with arrows for the variants.
- Args:
- variant_track (matplotlib.axes.Axes): axis for the variant track.variant_df (DataFrame): contains the variant information.transcript_len (int): transcript length.setting_dict (dictionary): settings for making the png.
- Returns:
- variant_track (matplotlib.axes.Axes): axis for the variant track.
-
variants.get_arrow_height_s(top_s, setting_dict)[source]¶ Get the height of the arrow.
- Args:
- top_s (Series): indicates whether a variant is annotated with an arrow above or beneath the colorbar.
- Returns:
- height_s (Series): indicates the height the arrow used to annotate each variant.
-
variants.get_variant_df(transcript, variant_file)[source]¶ Read the variant information from a tsv file into a DataFrame.
- Args:
- transcript (str): Ensembl transcript ID.variant_file (str): path to file containing the variants.
- Returns:
- variant_df (DataFrame): contains the variant information.
-
variants.make_track(variant_track, transcript_len, bound_l, color_l, edge_color_l, variant_df, setting_dict, variant_key)[source]¶ Make the variants track.
- Args:
- variant_track (matplotlib.axes.Axes): axis for the variants trackexon_coord_df (DataFrame): contains the exon base pair and transcript position coordinates.bound_l (list of ints): contains the exons and utr bounds to be used in making the color bar.color_l (list of strs): contains the list of colors to be used in making the color bar.edge_color_l (list): contains the list of edge colors to be used in making the color bar.variant_df (DataFrame): contains the variants information.setting_dict (dictionary): settings for making the png.variant_key (matplotlib.axes.Axes): axis for the variants key.
-
variants.make_variant_annotations_key(variant_key, variant_df, setting_dict)[source]¶ Make a variant annotations key.
- Args:
- variant_key (matplotlib.axes.Axes): axis for the variant key.variant_df (DataFrame): contains the variant information.setting_dict (dictionary): settings for making the png.
- Returns:
- variant_key (matplotlib.axes.Axes): axis for the variant key.
settings
-
settings.display_setting_dict(setting_dict)[source]¶ Pretty print the setting_dict.
- Args:
- setting_dict (dictionary): settings for making the png.
-
settings.get_setting_dict()[source]¶ Create a dictionary of settings to use in making the png. If the user wishes to change any of these default settings, then they should call this function to return the dictionary and change the values for the relevant keys.
- Returns:
- setting_dict (dict): settings for making the png.